Not Issued
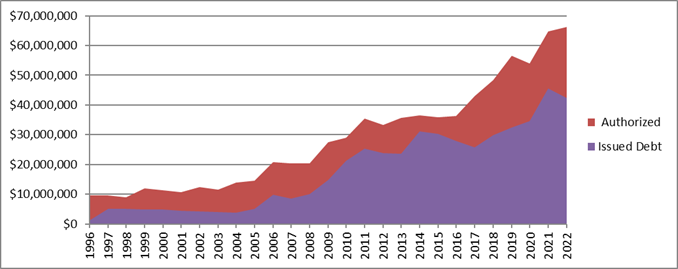
| Teaneck NJ Debt - 1996 to 2022 | |||||||||||||||||
| (from Teaneck Annual Debt Statements) | |||||||||||||||||
| Year | Authorized | Authorized Not Issued |
Issued Debt | Debt % | BofE Debt |
|
|||||||||||
| 1996 | $9,686,784 | $8,539,284 | $1,147,500 | 0.37% | $6,463,000 | ||||||||||||
| 1997 | $9,557,575 | $4,477,575 | $5,080,000 | 0.36% | $6,253,000 | ||||||||||||
| 1998 | $8,947,168 | $3,934,668 | $5,012,500 | 0.34% | $6,023,000 | ||||||||||||
| 1999 | $11,911,698 | $6,966,698 | $4,945,000 | 0.44% | $5,783,000 | ||||||||||||
| 2000 | $11,318,124 | $6,543,624 | $4,774,500 | 0.40% | $25,217,380 | ||||||||||||
| 2001 | $10,790,124 | $6,436,124 | $4,354,000 | 0.36% | $16,779,000 | ||||||||||||
| 2002 | $12,317,516 | $8,031,016 | $4,286,500 | 0.37% | $16,379,000 | ||||||||||||
| 2003 | $11,601,315 | $7,582,315 | $4,019,000 | 0.32% | $15,949,000 | ||||||||||||
| 2004 | $13,973,221 | $10,221,721 | $3,751,500 | 0.34% | $21,541,000 | ||||||||||||
| 2005 | $14,631,203 | $9,452,203 | $5,179,000 | 0.33% | $20,751,000 | ||||||||||||
| 2006 | $20,768,193 | $11,033,693 | $9,734,500 | 0.41% | $19,946,000 | ||||||||||||
| 2007 | $20,382,293 | $11,947,293 | $8,435,000 | 0.36% | $19,096,000 | ||||||||||||
| 2008 | $20,337,427 | $10,351,927 | $9,985,500 | 0.34% | $18,490,000 | ||||||||||||
| 2009 | $27,405,592 | $12,617,627 | $14,787,965 | 0.44% | $17,545,000 | ||||||||||||
| 2010 | $29,086,357 | $7,878,466 | $21,207,891 | 0.48% | $16,565,000 | Deductions | Net | Debt % | Equalized Value Basis | ||||||||
| 2011 | $35,372,957 | $10,146,683 | $25,226,274 | 0.60% | $15,530,000 | $5,950,000 | $29,422,957 | 0.497% | $5,914,379,011 | ||||||||
| 2012 | $33,288,371 | $9,438,521 | $23,849,850 | 0.58% | $22,625,000 | $5,450,000 | $27,838,371 | 0.487% | $5,722,133,408 | ||||||||
| 2013 | $35,560,078 | $12,013,991 | $23,546,087 | 0.65% | $21,190,000 | $6,538,000 | $29,022,078 | 0.527% | $5,508,992,642 | ||||||||
| 2014 | $36,507,697 | $5,459,315 | $31,048,382 | 0.69% | $19,350,000 | $5,394,000 | $31,113,697 | 0.588% | $5,288,693,618 | ||||||||
| 2015 | $35,968,835 | $5,706,673 | $30,262,162 | 0.69% | $18,045,000 | $4,476,696 | $31,492,139 | 0.605% | $5,206,949,480 | ||||||||
| 2016 | $36,244,639 | $8,294,473 | $27,950,166 | 0.68% | $16,085,000 | $3,444,132 | $32,800,508 | 0.619% | $5,300,503,133 | ||||||||
| 2017 | $43,041,007 | $17,369,473 | $25,671,534 | 0.79% | $14,580,000 | $2,561,012 | $40,479,995 | 0.744% | $5,437,207,955 | ||||||||
| 2018 | $48,308,843 | $18,373,945 | $29,934,898 | 0.86% | $13,050,000 | $1,861,526 | $46,447,317 | 0.826% | $5,620,635,162 | ||||||||
| 2019 | $56,487,756 | $24,054,895 | $32,432,861 | 0.96% | $11,470,000 | $958,691 | $55,529,065 | 0.947% | $5,861,955,211 | ||||||||
| 2020 | $53,891,004 | $19,217,695 | $34,673,309 | 0.88% | $9,840,000 | $231,612 | $53,659,392 | 0.877% | $6,117,710,209 | ||||||||
| 2021 | $64,724,615 | $19,193,275 | $45,531,340 | 1.02% | $8,795,000 | $8,550,666 | $56,173,949 | 0.886% | $6,337,288,342 | ||||||||
| 2022 | $66,246,425 | $23,871,175 | $42,375,250 | 0.99% | $7,590,000 | $8,205,779 | $58,040,646 | 0.872% | $6,658,364,520 | ||||||||
| All columns and the chart represent municipal debt except the BofE Debt | |||||||||||||||||
| The Debt% represents the Debt as a percentage of Equalized Value. Up till 2010 this was calculated based on total authorized debt. Starting in 2011 the authorized debt | |||||||||||||||||
| excludes certain Deductions and is calculated on the Net after the exclusions. The section with the grey background shows those calculations. | |||||||||||||||||
| © 2013, 2014, 2015, 2016, 2017, 2018, 2019, 2020, 2021, 2022, 2023 Tom Abbott | |||||||||||||||||